


Map Statistics
Дата: 06.04.2012 23:04:18
LiannaSilverwind: I have counted down saved replays of my Bat-Chatillion gameplay
before patch 7.2.
420 replays were saved. Some were lost due to gamecrashes that are persistent for me after 7.0 patch. Still 420 seems to be nice enough number to make certain statistics.
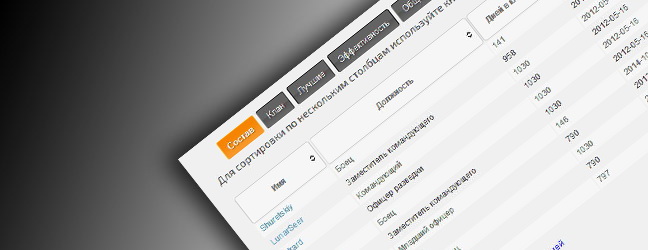
Map - Count - Percentage
Abbey - 23 - 5.5%
Arctic Bay - 15 - 3.6%
Cliff - 10 - 2.4%
El Halluf - 11 - 2.6%
Ensk - 25 - 6.0%
Erlenberg - 12 - 2.9%
Fishing Bay - 16 - 3.8%
Fjord - 16 - 3.8%
Himmelsdorf - 24 - 5.7%
Karelia - 17 - 4.0%
Karelia - 17 - 4.0%
Komarin - 12 - 2.9%
Lakeville - 25 - 6.0%
Malinovka - 28 - 6.7%
Mines - 12 - 2.9%
Mountain Pass - 17 - 4.0%
Murovanka - 12 - 2.9%
Prohorovka - 26 - 6.2%
RedShire - 11 - 2.6%
Ruinberg - 18 - 4.3%
Sand River - 19 - 4.5%
Siegfried Line - 19 - 4.5%
Steppes - 13 - 3.1%
Swamp - 9 - 2.1%
Westfield - 13 - 3.1%
So, which maps do we encounter most often as Bat-Chatillion?
Malinovka - 6.7%
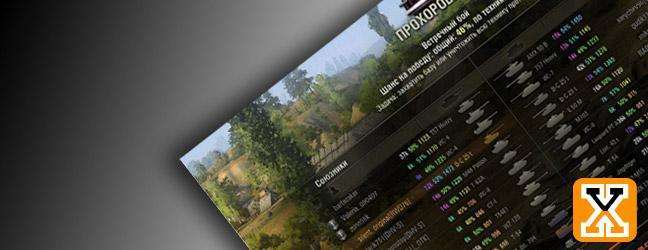
Prohorovka - 6.2%
Lakeville and Ensk - 6.0%
Himmelsdorf - 5.7%
Abbey - 5.5%
Which maps are most rare for Bat-Chatillion?
Swamp - 2.1% (probably because it's one of the newest maps its stats are low compared to the other)
Cliff - 2.4%
El Halluf and Redshire - 2.6%
Erlenberg, Komarin, Mines, Murovanka - 2.9%
Steppes, Westfield - 3.1%
Arctic Bay - 3.6%
In short...
If you hate Malinovka, Prohorovka, Ensk or Lakeville, remember - they make 25% of Bat-Chatillion's gameplay.
420 replays were saved. Some were lost due to gamecrashes that are persistent for me after 7.0 patch. Still 420 seems to be nice enough number to make certain statistics.
Map - Count - Percentage
Abbey - 23 - 5.5%
Arctic Bay - 15 - 3.6%
Cliff - 10 - 2.4%
El Halluf - 11 - 2.6%
Ensk - 25 - 6.0%
Erlenberg - 12 - 2.9%
Fishing Bay - 16 - 3.8%
Fjord - 16 - 3.8%
Himmelsdorf - 24 - 5.7%
Karelia - 17 - 4.0%
Karelia - 17 - 4.0%
Komarin - 12 - 2.9%
Lakeville - 25 - 6.0%
Malinovka - 28 - 6.7%
Mines - 12 - 2.9%
Mountain Pass - 17 - 4.0%
Murovanka - 12 - 2.9%
Prohorovka - 26 - 6.2%
RedShire - 11 - 2.6%
Ruinberg - 18 - 4.3%
Sand River - 19 - 4.5%
Siegfried Line - 19 - 4.5%
Steppes - 13 - 3.1%
Swamp - 9 - 2.1%
Westfield - 13 - 3.1%
So, which maps do we encounter most often as Bat-Chatillion?
Malinovka - 6.7%
Prohorovka - 6.2%
Lakeville and Ensk - 6.0%
Himmelsdorf - 5.7%
Abbey - 5.5%
Which maps are most rare for Bat-Chatillion?
Swamp - 2.1% (probably because it's one of the newest maps its stats are low compared to the other)
Cliff - 2.4%
El Halluf and Redshire - 2.6%
Erlenberg, Komarin, Mines, Murovanka - 2.9%
Steppes, Westfield - 3.1%
Arctic Bay - 3.6%
In short...
If you hate Malinovka, Prohorovka, Ensk or Lakeville, remember - they make 25% of Bat-Chatillion's gameplay.
 Game Discussion\Map Discussion\Map Statistics